Introduction
Between 50 and 90% of adults with concussion (mild traumatic brain injury [mTBI]) experience symptoms of vestibular, visual, and/or oculomotor dysfunction,1 such as feelings of dizziness, impaired vision, balance problems, nausea and disorientation.2 Individuals with visual-vestibular symptoms often report that their symptoms are exacerbated when they are engaged in tasks that occur in complex, busy or moving visual environments3–5 particularly when they rely on careful processing of visual and vestibular cues, such as when grocery shopping or when riding as a passenger in a moving vehicle.3,6 During these common everyday self-motion tasks, the brain must effectively integrate information from across the sensory systems including visual, vestibular, proprioceptive and auditory inputs. Typically, the brain benefits from combining multiple sources of congruent and redundant sensory information and weights sensory inputs based on their individual reliabilities.7–11 However, errors in integrating across these sensory inputs or non-optimal weighting of individual sensory cues could result in adverse perceptual and behavioral outcomes such as poor movement coordination and increased falls risk. There have been some assertions that individuals with concussion may integrate multiple sensory inputs (e.g., visual and vestibular) non-optimally and may not effectively weight individual sensory inputs based on the individual reliabilities, but rather over-weight dynamic visual information.12,13
Visual dependence & postural stability in concussion
While self-motion perception relies on the integration of multiple sensory inputs, visual information is particularly salient in the perception of self-motion. Indeed, many studies have shown that global visual perturbations (e.g., changes in direction or speed of global optic flow during walking or quiet stance) influence postural responses in healthy participants.14–20 Some individuals will consistently rely more heavily on visual cues relative to other sensory inputs in spatial orientation tasks, even when relying on somatosensory or vestibular inputs might be considered more optimal.21,22 This phenomenon is commonly referred to as ‘visual-dependence’ or ‘field-dependence’. Interestingly, individuals who often report symptoms of dizziness tend to demonstrate increased visual dependence, even when visual information is what triggers their symptoms of dizziness.3,6,23–25 While it is unclear how visual dependence develops in the general population, a recent review by the executive committee of the European Society for the Clinical Evaluation of Balance Disorders suggests that visual dependence can be influenced by clinical conditions such as vestibular end-organ disease, psychiatric conditions or brain trauma.12
The mechanisms underlying the potential increase of visual dependence in individuals post-concussion is unclear. One current hypothesis is that top-down visual processing may be disrupted via damage to the dorsolateral prefrontal cortex and certain dorsally projecting pathways to the posterior parietal cortex.26 Such disruptions could lead to stronger bottom-up visual processing which could overwhelm and distract individuals in complex and visually stimulating situations.
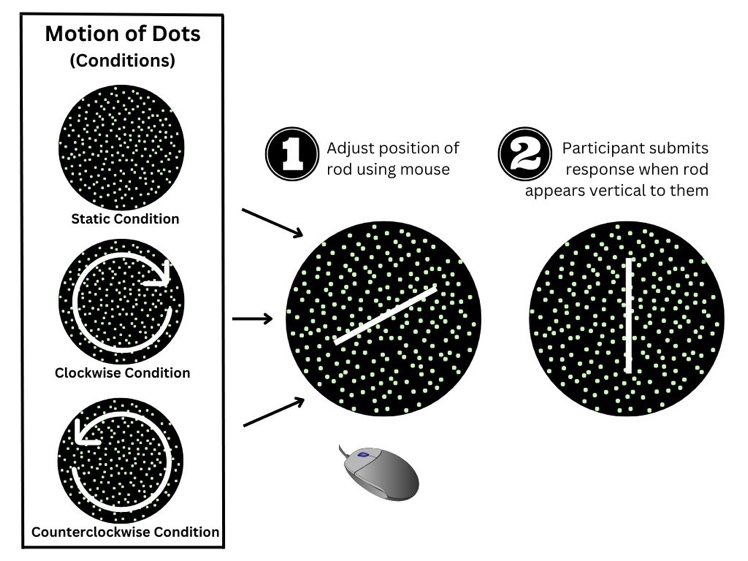
While there is no standardized clinical test for assessing visual dependence,12 it can be tested using tasks such as the rod and frame task22 or the rod and disk task.27,28 The rod and frame and rod and disk tasks measure participants’ subjective visual vertical (SVV) by placing them in a dark environment and asking them to rotate a white/fluorescent rod until it is aligned with gravity (vertically). In the rod and frame task, the rod is surrounded by a box which may be angled to the left or right. In the rod and disk task, the rod is surrounded by a disk populated with dots and the disk is either static or rotating in a clockwise or counterclockwise direction. In both tasks, participants are instructed to ignore the box or rotating dots when adjusting the verticality of the rod. It is assumed that SVV estimates will be more heavily influenced by the angle of the frame or rotation of the dots in individuals who are more visually dependent.29–31
Even though individuals with chronic concussion often show normal peripheral vestibular and visual system functioning according to clinical sensory tests, around 28% of individuals will report balance problems over a year following their injury.32–35 This balance dysfunction may be due to changes in the processes underlying sensory integration.33 In some patients, including (but not exclusive to) those with concussion, visually cluttered environments or the presence of visual motion, like when in a grocery store, may lead to symptoms of dizziness (known as visual-vertigo or visually induced dizziness).20
The role of vection
A different perceptual self-motion phenomenon commonly experienced during everyday situations is ‘vection’. Vection is the illusion of self-motion that is typically caused by global, dynamic visual motion in the absence of any actual physical self-motion through space.36–38 A common example of vection is the train illusion whereby a passenger on a stationary train may experience a brief compelling illusion that their own train is moving, when really it is the visual motion of the adjacent train as it begins to move that causes this illusion.39 Importantly, this illusion occurs in spite of the fact that all other non-visual sensory inputs (e.g., vestibular, proprioceptive and vibrotactile) indicate that the observer is not moving. Vection has been associated with visual dependence and behavioral outcomes such as postural sway. For instance, individuals who are more visually (or field) dependent are more susceptible to experiencing vection.40 Further, larger postural sway has been associated with stronger feelings of vection41 and individuals who are more visually dependent tend to show greater sway during vection-inducing tasks.42 Notably, vection is different from visually-induced dizziness (VID) which is often described as a disrupted sense of spatial orientation in the presence of visual stimuli, but without the sense of illusory self-motion that is experienced during vection.3,43,44 Studying vection differs from studying VID since vection also occurs in healthy individuals and is not necessarily associated with dizziness. Vection also provides insights into how changes in perceptual processes might be associated with visual dependence, multisensory integration and behavioral outcomes (even in the absence of symptomatic dizziness). While a great deal of research has been done to understand the conditions under which vection occurs, to our knowledge, nothing is yet known about whether individuals with concussion experience vection differently from individuals without concussion. If individuals with concussion are more strongly influenced by visual motion and/or if they experience changes to visual-vestibular integration during self-motion, they may be more susceptible to vection than individuals without concussion. This higher susceptibility to vection may have potentially destabilizing behavioral consequences such as increased postural sway.
Current study
The main goal of the current study was to examine whether the experiences of vection differ in persons post-concussion compared with healthy controls without concussion. To test this, participants with a history of concussion (currently symptomatic and asymptomatic) and participants with no history of concussion (healthy controls) were exposed to an immersive visual scene comprised of an outwardly radiating grocery store aisle while their postural sway and vection sensation was measured. In addition, a measure of visual dependence as well as standardized measures of basic visual, vestibular and cognitive abilities, general health and subjective dizziness were also collected.
To summarize, the three objectives of this study were to: 1. Evaluate whether vection ratings are higher in concussed individuals relative to age-matched controls without concussion. 2. Examine whether higher vection ratings result in greater postural sway (e.g., COP path length) and whether this prediction is moderated by group (controls vs. concussed). 3. Determine whether higher vection ratings are associated with greater visual dependence, and whether these associations are greater in concussed individuals than in healthy controls.
Materials & methods
Participants
Adults between the ages of 18 and 60 years (see Table 1 for demographic information) were recruited through flyers posted at the University Health Network, at local concussion clinics and in the surrounding community. Participants were characterized as either having sustained a concussion (“concussed”) or “healthy” based on self-report, as is generally seen in the literature. We also recorded participants’ self-reported symptom status (i.e., currently symptomatic, or asymptomatic). Concussed participants were also asked whether they had been diagnosed by a medical professional, signs and symptoms, mechanisms of injury, as well as treatments they had received. Importantly, all participants in the concussion group were clinically diagnosed by a physician apart from three asymptomatic participants (out of n = 9). Further, another two symptomatic (out of n = 6) participants did not answer whether they had been clinically diagnosed but instead described that they had received treatments by occupational therapists, physiotherapists, as well as other health care professionals. Finally, if self-reporting as currently symptomatic, these concussed participants were also asked the date it occurred.
As such, there were two main groups: controls with no history of concussion or brain injury; and individuals post-concussion who had a history of one or more medically diagnosed concussions. The latter group was also descriptively categorized as being either ‘symptomatic’ in that they were currently reporting chronic post-concussion symptoms, or ‘asymptomatic’, in that they were no longer reporting symptoms. Concussions were defined based on clinical criteria current at the time of recruitment,45 and patients in the symptomatic group were considered to have chronic symptoms if they remained symptomatic three or more months past their date of injury. Note that for all analyses the symptomatic and asymptomatic groups were collapsed given the small n in each group, but in some figures (e.g., Figure 4), they are differentiated by color to allow for visual/descriptive comparisons.
Participants in both groups self-reported no history of stroke, psychiatric, vestibular, or musculoskeletal disorders or other major health conditions (e.g., diabetes) other than concussion (concussion group only). Due to the evolving discussion in the literature regarding migraine status in concussed individuals [e.g., see46], we also asked participants in this study if they experience migraines. Only two participants in the concussion group (n = 1 asymptomatic, and n = 1 symptomatic), reported experiencing migraines after their concussion. Written informed consent was provided prior to the study and participants were paid $50 (in the form of a gift card) for their participation. This research was conducted in compliance with the American Psychological Association Code of Ethics and was approved by the University Health Network Research Ethics Board (19-5060).
Baseline assessments
Sensory tests
Static visual acuity
Participants completed a standard visual acuity test (Early Treatment Diabetic Retinopathy Study [ETDRS47]). Specifically, participants stood 4 m away from the standard ETDRS eyechart and were asked to read the letters. The last line that participants correctly identified at least 3/5 letters was recorded. A score of -0.2 to 0.5 logMAR units was considered as the range for normal to near-normal visual acuity (see Table 2). Participants completed this task with each eye individually, and binocularly.
Dynamic visual acuity
Participants completed the dynamic visual acuity [DVA48] test as a measure of vestibular function and the ability to control the eyes during head movement (vestibulo-ocular function). Participants were seated at a distance of 4 m away from the standard ETDRS eye chart, the experimenter then stood behind the participant and tilted the participant’s head 30 degrees forward, and then moved the participant’s head side to side at a frequency of approximately 2Hz while the participant again read to the lowest line on the ETDRS chart they could correctly identify. The decrement in visual acuity that occurred with head movement, relative to the standard binocular vision test score described above, was recorded as each participant’s DVA score (see Table 2).
Rod & disk task
Participants completed a computerized rod and disk task to measure their visual dependence. They were seated in front of a computer monitor and rested their head against a viewing tube (20 cm in length) which was pressed against the computer monitor and was used to block surrounding visual cues from the environment. Participants also had their head covered with a cloth to further reduce external visual cues. The visual stimulus was a 6 cm white line (“rod”) on a black background.28 The black background was filled with 220 randomly distributed green dots (Figure 1). For the rod and disk task, participants were instructed to align the rod with their SVV under three experimental conditions. In the first condition, the background dots were stationary. In the second and third conditions, the array of dots rotated clockwise or counterclockwise, respectively, at 10° per second. The rod could be manually rotated/adjusted by participants in the roll plane 360° clockwise or counterclockwise from its midpoint at the center of the visual field, and subjects controlled the orientation of the rod with a roller mouse. The purpose of the first, static, condition was not only to obtain a baseline measure for the two rotating disk conditions, but also as a measure of static SVV since SVV is often used as an indirect measure of vestibular functioning.

The rod tilt angle that participants adjusted the orientation to was recorded and the difference in degrees between true vertical (0°) and the participants’ final orientation placement angle of the rod was calculated. The ‘equivalency score’ was calculated as the difference between the mean angle recorded for the static condition and the mean angle recorded for each of the counterclockwise and clockwise conditions respectively, then converted to absolute values and averaged (see Equation 1).
mean(abs(meanstatic − meanclockwise)− abs(meanstatic − meancounterclockwise))
Participants completed 12 trials in each of the three conditions (static, clockwise, counterclockwise) for a total of 36 trials. The condition with static background dots was always presented first, and the presentation order of the clockwise and counterclockwise conditions was randomized.
Dizziness, simulator sickness & concussion assessments
All participants completed the Dizziness Handicap Inventory [DHI49], the Simulator Sickness Questionnaire (SSQ; pre- and post-task) and the Vestibular Disorders of Activities of Daily Living Scale [VD-ADL50].All participants also completed the Patient Health Questionnaire-15 (PHQ-15) to measure any somatic symptom burden and to help differentiate between somatic and physiologic concussion symptoms.51 Most participants with concussion (n = 13) also completed the Rivermead Post-Concussion Symptom Inventory to record the number and severity of their concussion-related symptoms.52 The results of the DHI and PHQ-15 in relation to visually induced motion sickness (measured via the SSQ) are described in further detail in Keshavarz et al. (2024).53 See also Table 2.
Experimental task
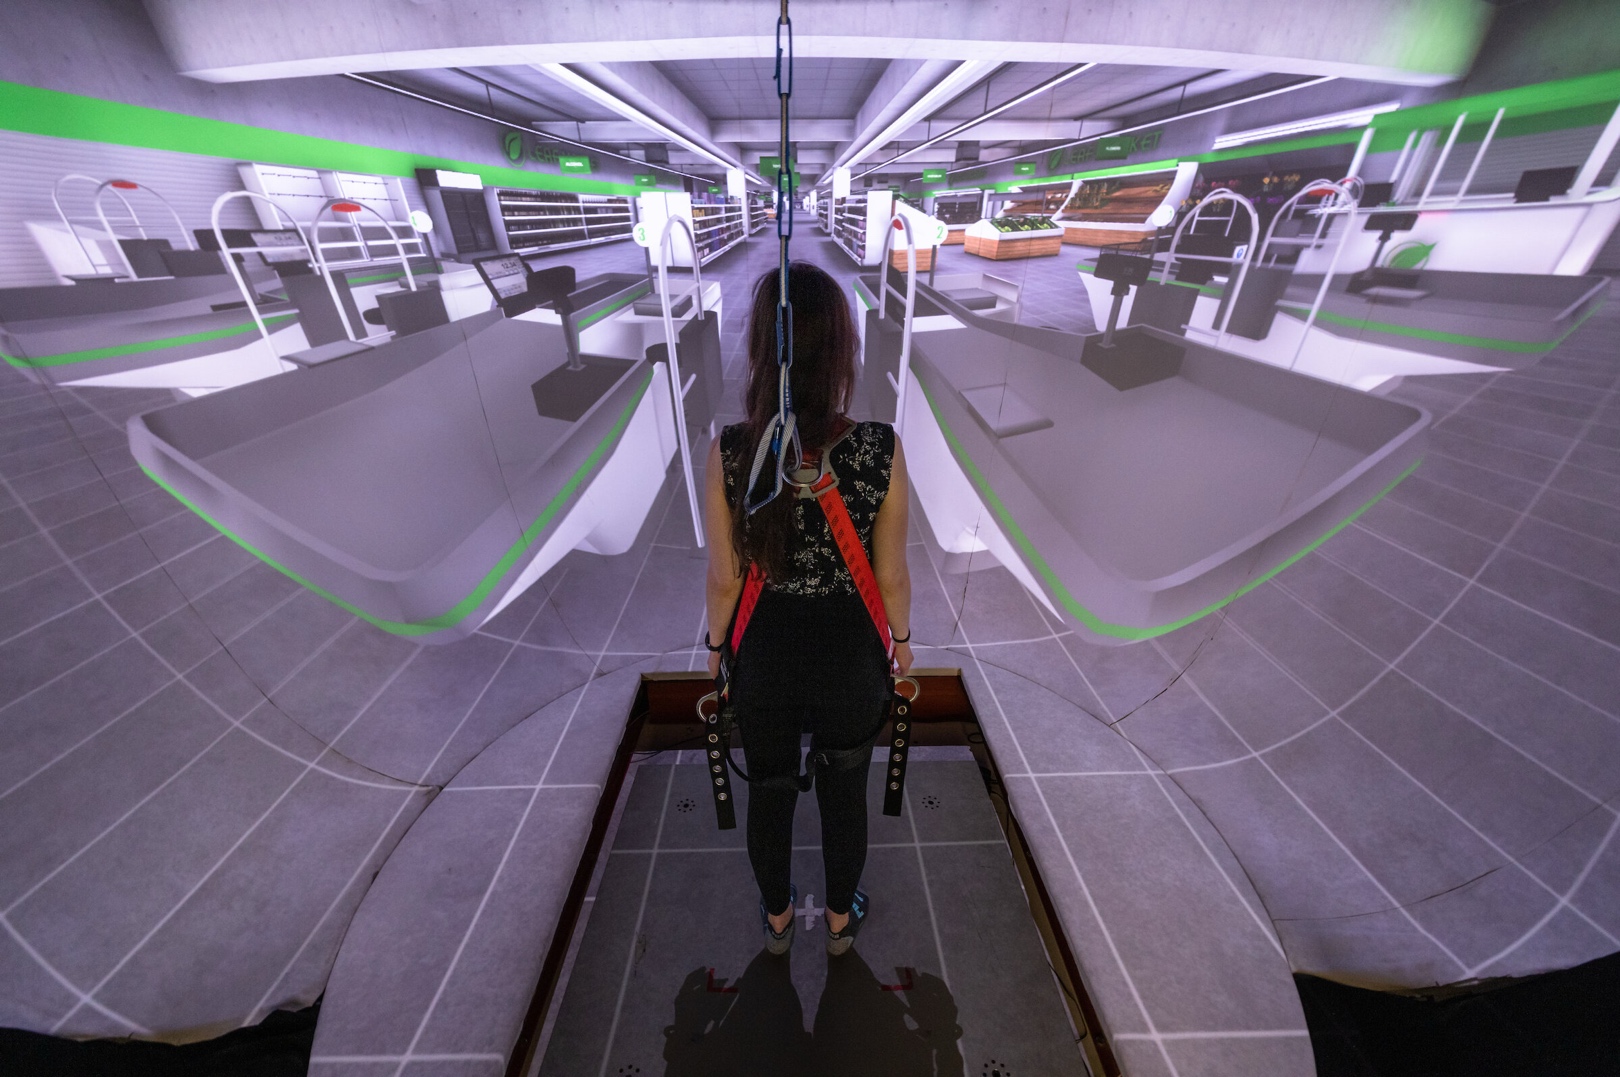
This experiment took place at the Challenging Environment Assessment Lab (CEAL) at the KITE Research Institute, Toronto Rehabilitation Institute – University Health Network where we visually-presented self-motion trajectories down the aisle of a grocery store to measure subjective ratings of vection and postural responses (COP).
Stimuli & apparatus
This study used CEAL’s StreetLab, an immersive virtual reality lab that surrounds participants with a 240° horizontal, by 110° vertical field-of-view projection display (Figure 2). StreetLab was equipped with an AMTI (Advanced Mechanical Technology Inc., MA, USA) strain gauge forceplate, which collected data at a sampling rate of 1000 Hz.

For each trial, the first five seconds of the data were removed. The rest of the data were then passed through a secondorder zero-lag dual-pass Butterworth filter with a 6 Hz cut-off frequency. We used MATLAB to extract mean total, anterior-posterior (AP), and medio-lateral (ML) COP path lengths as well as root-mean-squared (RMS) path lengths. Path length here is defined as the absolute total length of sway in centimeters recorded in each condition. We also report AP and ML velocities, as well as RMS velocities. Velocities here are defined as path lenth (cm) divided by time (seconds). In other words, higher variability in postural sway is indicated by larger path lengths.
A virtual grocery store scenario was developed and presented using Unity (Unity version 2019.2.2f1 by Unity Technologies Inc.) and MATLAB R2015b (The MathWorks Inc., 2015). The scenario consisted of a straight grocery store aisle stocked with dry-goods on the shelves. Other areas of the grocery store, including other aisles and a produce section, were visible when participants were positioned at the start of the aisle. The aisle was approximately 145 m long and 4.4 m wide. Participants virtually moved straight forward down the grocery store aisle
The peak visual speeds of the optic flow stimuli differed across trials ranging from 0.07 to 4.0 m/s (intervals included 15 separate trials, each with a different and randomized, peak velocity: 0.07, 0.36, 0.6, 0.8, 1.0, 1.2, 1.4, 1.6, 1.8, 2.0, 2.4, 2.8, 3.2, 3.6 and 4.0 m/s). Each trial lasted 30 s, with the first and last 0.5 s used to accelerate and decelerate, maintaining a constant peak speed for the remainder of the trajectory.
Procedure
After providing written informed consent, participants completed the baseline assessments followed by the experimental session in StreetLab. After completing the rod and disk task, participants entered StreetLab to complete the vection and posturography tasks. In StreetLab participants stood at the centre of the forceplate with feet approximately hip-width apart. The forceplate measured their COP during each 30-s trial in which they visually experienced themselves travelling down the grocery store aisle. During each trial, participants were asked to stand comfortably still without talking or moving their arms or heads and to look at the screen. A fixation cross was displayed at the start of the trial and was removed when the task began. Participants wore a loose-fitting harness which was tethered to an anchor attached to the ceiling to prevent falls but did not support body weight while standing. Prior to starting the visual task, the experimenter described vection as the illusion of self-motion, “the feeling that your body is moving when no movement actually takes place,” and provided participants with a description of the train illusion as being a relatable, representative example of vection. Participants were presented one trial at each of the 15 speeds in random order. Each trial lasted 30 s. At the end of each trial, participants were asked to rate how strongly they perceived the sensation of vection (vection intensity),54 with 0 meaning no vection at all and 10 being very strong vection. This rating scale is a validated tool for measuring perceived vection intensity.54 Once all trials were complete, participants were debriefed and provided with their compensation.
Statistical analysis
COP path length and COP velocity for each 30-s trial were calculated using MATLAB. All statistical analyses were conducted using R version 3.6.2 (R Foundation for Statistical Computing, 2016). Three separate analyses were conducted for the experimental portion of the task to address the three objectives outlined above.
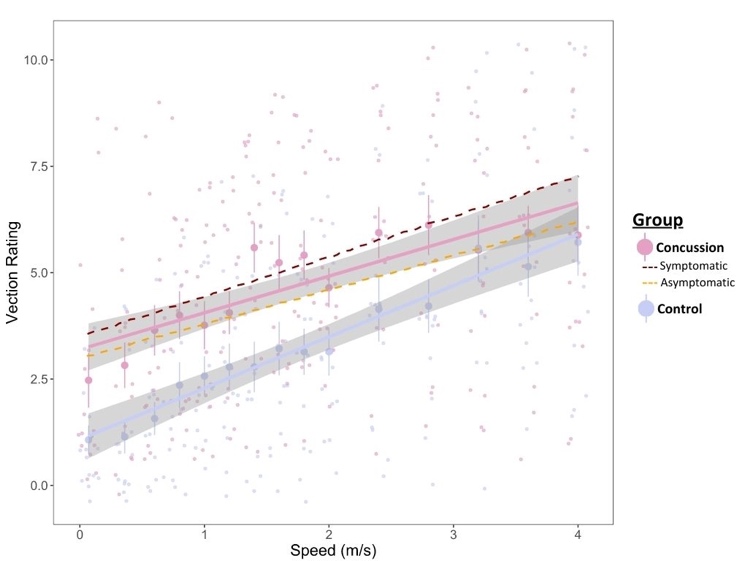
To address the first objective, we used a linear mixed effects model to examine whether concussed participants reported higher vection ratings than controls and whether visual speeds were associated with greater vection. Specifically, we predicted ‘Vection Ratings’ from the participant ‘Group’ (i.e., Control and Concussion; although see Supplemental Materials for analyses with ‘Group’ defined as Control vs. Symptomatic Concussed vs. Asymptomatic Concussed) and ‘Visual Speed’ of the visual stimulus (0.07–4 m/s). We ran and compared two models: one with a random intercept for each participant and another with this same random intercept as well as a random slope for ‘Visual Speed’. Model comparisons revealed a significant difference between both models and the more complex model was selected due to having the lowest AIC: We also assessed the model’s general goodness of fit using r2 (marginal and conditional): = .257, = .688. Contrasts were used for post-hoc analyses of significant effects.
To address the second objective, we used a linear mixed effects model to examine whether ‘Vection Ratings’, ‘Group’, and ‘Visual Speed’ of the visual stimulus predicted ‘Postural Stability’ (COP path length). The individual variables were defined as specified in the analyses from the first objective, above. Once again, in the supplemental materials ‘Group’ is defined as Control vs. Symptomatic Concussed vs. Asymptomatic Concussed (unlike the analyses in this main text which defines ‘Group’ as Concussed vs. Control). The variable COP path length was winsorized by group to reduce the skewness of the residuals. Specifically, data points above the 99th percentile (2.6% of all the data) were replaced with data at the 99th percentile, and data below the first percentile were replaced with data at the first percentile. For this analysis, several models were compared: one with a random intercept for each participant, a second with this same random intercept as well as a random slope for ‘Visual Speed’, a third with the random intercept for each participant as well as a random slope for ‘Vection Rating’, and a final model with the random intercept for each participant, a random slope for ‘Visual Speed’ as well as a random slope for ‘Vection Rating’. The most complex model did not converge, and model comparisons between the remaining three models revealed significant differences. The simplest model was chosen due to having the lowest AIC: Marginal and conditional r2 were also computed to assess the chosen model’s general goodness of fit, = 0.180, = 0.640. Contrasts were used for post-hoc analyses of significant effects.
To address the third objective, we conducted a series of Bonferroni-corrected correlations to evaluate whether baseline measures (e.g., DVA; VD-ADL) were associated with experimental measures (visual dependence, vection, posturography).
Results
A summary of the baseline data is provided in Table 2, and experimental data are provided in Table 3.
Predicting vection ratings from group & visual speed
Using the lmer function from the lme4 package in R 3.3.1, a linear mixed effects model predicting Vection Ratings from Group and Visual Speed, with a random intercept for participant was estimated with an unstructured covariance matrix. The model revealed significant main effects for Group (Figure 3), b = -2.115, SE = 0.675, t (29) = -3.134, p = 0.004, with concussed participants having higher Vection Ratings than control participants, and for Visual Speed, b = 0.861 = 0.203, t (29) = 4.244, p = 0.0002, with faster Visual Speeds resulting in higher Vection Ratings. There was no significant interaction between Group and Visual Speed, b = 0.344, SE = 0.302, t (29) = 1.140, p = 0.264 (Figure 3).

Predicting postural responses from group, vection ratings & visual speed
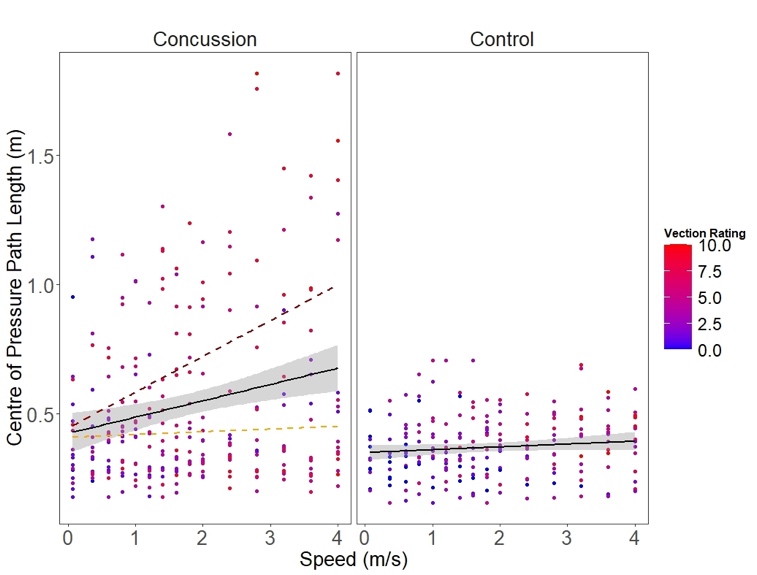
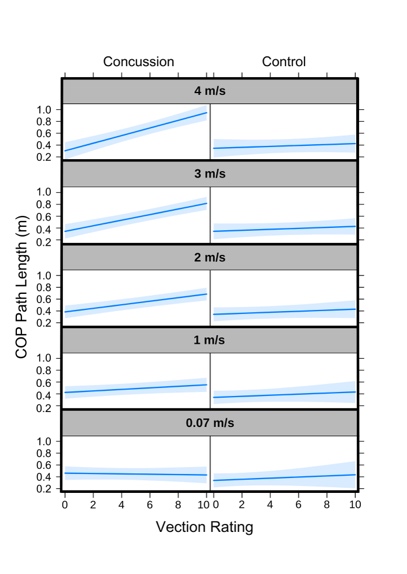
A model with Group, Vection Rating and Visual Speed as independent variables, a random intercept for each participant and COP path length as the dependent variable was estimated using the lme4 package’s lmer function, with an unstructured covariance matrix (Figure 4). The results showed a significant main effect for Visual Speed, b = -0.040, SE = 0.020, t (435) = -2.053, p = 0.041, significant interaction for Vection Rating Visual Speed, b = 0.017, SE = 0.004, t (435) = 4.781, p < 0.001 and a significant three-way interaction for Group Vection Rating Visual Speed, b = -0.018, SE = 0.005, t (433) = -3.218, p = 0.001.

On the other hand, Group, b = -0.126, SE = 0.085, t (435) = -1.478, p = 0.144, Vection Rating, b = -0.004, SE = 0.008, t (435) = -0.493, p = 0.622, Group Vection Rating, b = 0.014, SE = 0.015, t (435) = 0.899, p = 0.369 and Visual Speed Group, b = 0.042, SE = 0.027, t (435) = -1.548, p = 0.122, were all non-significant.
Regarding the three-way interaction, separate post-hoc comparisons between the control and concussed participants revealed that the Vection Rating Visual Speed interaction was significant in the concussed participants, F(1, 435) = 22.827, p < 0.001, but not the controls, F (1, 431) = 0.011, p = 0.917, such that greater Vection Ratings predicted larger COP path length (greater sway) in concussed participants, particularly as the Visual Speed of the optic flow stimulus increased (as illustrated by the increasingly steeper slope with increasing Visual Speeds for the concussed group but not control group, Figure 5).

Associations between baseline & experimental measures
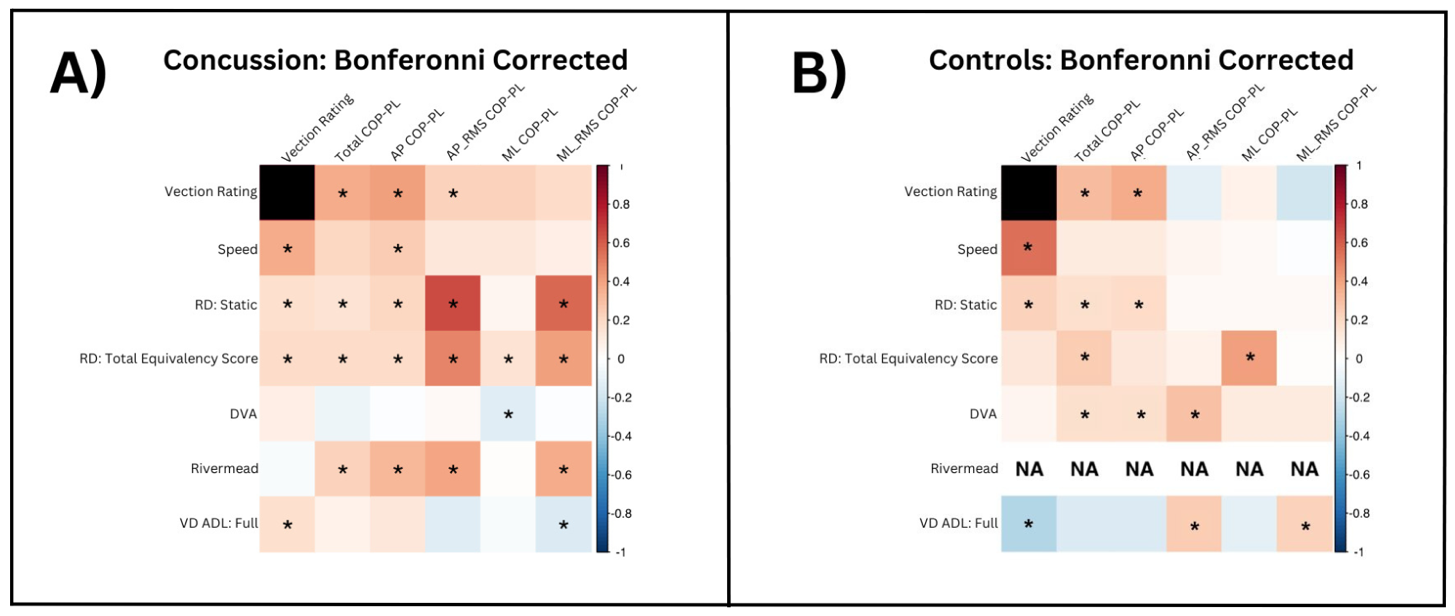
A series of Bonferroni-corrected correlations were conducted to examine the association between experimental and baseline measures for the concussion (Figure 6A) and control (Figure 6B) groups, respectively. Overall, there were more and stronger correlations among vection rating, visual dependence and postural sway in the concussion group compared with the control group, described in more detail below.
**_concussion_and_**(b)**_control_groups._blue_squares_repre.png)
Vection & visual dependence
For the concussion group only, vection ratings were positively correlated with visual dependence (equivalency score), with greater vection intensity associated with higher visual dependence.
Vection & postural sway
For the concussion group, vection ratings were positively correlated with nearly all measures of postural sway, with greater vection rating intensities being associated with greater and more variable sway. For the control group, vection ratings were positively associated with only two measures of postural sway (total path length and AP path length).
Visual dependence (i.e., RD total equivalency score) & postural sway
For the concussion group, visual dependence (total equivalency score) was positively associated with all postural measures, with greater visual dependence being associated with greater postural sway. For the control group, visual dependence was positively associated with only two postural measures (total path length and medio-lateral variability).
Vestibular function (as assessed by the static SVV)
For the concussion group, poorer vestibular function (i.e., higher SVV bias) was associated with greater and more variable postural sway across all measures apart from ML path length. For the control group, poorer vestibular functioning was only positively associated with total path length and AP path length. In concussed participants, DVA was negatively associated with COP path length in the ML direction, whereas in controls, it was positively associated with COP path length total, in the AP direction and AP-RMS.
Clinical tests of symptoms
Rivermead scores were positively associated with nearly all postural measures in the concussion group. Specifically, participants who reported more concussion-related symptoms on the Rivermead tended to show greater sway. The VD-ADL, however, was not associated with postural sway in concussed participants (apart from a weak and negative association with RMS COP path length-ML), but it was positively associated with vection ratings. In other words, reporting negative impacts from vertigo or dizziness in concussed individuals on activities of daily living was associated with stronger vection.
Discussion
The main objectives of this study were to assess the extent to which individuals with concussion are susceptible to vection relative to individuals without concussion, and whether this potentially increased susceptibility is associated with differences in visual dependence and/or changes in postural stability in response to visual perturbations. Overall, we found that individuals with concussion reported stronger experiences of vection compared with controls when travelling visually through a realistic, commonly experienced, cluttered scene (i.e., grocery store aisle) and that higher visual speeds were associated with higher vection ratings. With regards to visual dependence, we found that the equivalency scores (i.e., visual dependence) from the rod and disk task were significantly associated with increased vection ratings (only in concussed individuals) and with increased COP (more in concussed individuals than in controls). With regards to postural sway, an increase in vection intensity ratings and visual speed resulted in larger COP measures, but again only for individuals with concussion. In sum, these data provide evidence suggesting that individuals with concussion may be more susceptible to vection than individuals without concussion, and that this susceptibility may be affected by characteristics of the visual scene (i.e., visual speed of the stimulus) and/or may be related to differences in visual dependence and affect functional outcomes related to postural stability.
Higher vection ratings in concussed individuals with faster visual speeds
To our knowledge, this is the first study to demonstrate that individuals with concussion are more susceptible to vection than those without concussion. While concussion studies will usually test changes in oculomotor responses, vestibular end-organ functioning, visual dependence, or standing balance in order to gauge visual–vestibular symptomatology, the current study is unique as it specifically measures self-motion perceptual outcomes (i.e., vection).
Consistent with previous vection studies, participants in both groups reported stronger vection when the visual scene was moving faster compared with slower speeds.55,56 Vection ratings for individuals with concussion tended to diverge the most from those of healthy controls at optic flow rates of around 1.4 m/s. While in the Results section, we fit our vection rating data linearly against visual speed to align with the assumptions of our statistical analyses, a curvilinear function shows the pattern of group-divergent effects more clearly (see Supplementary Figure 1). Interestingly, this speed (1.4 m/s) is around the average comfortable human walking speed (between 1.2 and 1.4 m/s).57–59
Visual dependence, postural sway & multisensory weighting
The suggestion that concussion may be linked with increased visual dependence and changes in multisensory integration were partially supported by the results of the rod and disk visual dependence task in the current study. While not significant, visual dependence (equivalency scores) were higher in the concussion group (4.32) than the control group (2.98). Further, in the concussion group, higher visual dependence was also significantly positively associated with greater vection ratings; this relationship was not observed for controls, inconsistent with previous findings for other studies with healthy participants suggesting a general link between visual dependence (as measured by the rod and frame test) and vection intensity.60 For both groups, higher visual dependence was also associated with larger postural sway, but was clearly evident across more postural parameters in the concussion group than the control group. Higher visual dependence being positively associated with postural sway and vection ratings within the concussion group may also explain why the speed of the visual stimulus predicted greater postural sway in the concussion group only at faster speeds. Specifically, if these participants relied more heavily on visual information to inform self-motion perception, then as the speed of their visual motion increased, the effects on postural sway may be more pronounced. It is also possible, that when there is a mismatch in the information provided by individual sensory inputs (e.g., physically stationary while visually moving), individuals with concussion may be slower to resolve the sensory ambiguity and may rely more persistently on visual input during self-motion tasks with potential behavioral consequences due to sensory conflicts.3–5,43,44
Limitations & future directions
In the current study, it was not possible to quantify the weighting of individual sensory cues, such as weighting of vision relative to proprioceptive/vestibular cues. In future, this could be achieved by, for example, employing traditional multisensory integration study paradigms (e.g., visual–vestibular integration).61–67 Specifically, collecting participants’ self-motion estimates on unisensory tasks for each sensory input (e.g., visual and vestibular alone), and comparing them to multisensory tasks with congruent and incongruent bimodal inputs (e.g., visual-vestibular) would enable quantification of relative cue-weighting more concretely. Statistical modeling techniques such as maximum likelihood estimation or Bayesian modelling could then be applied to assess whether optimal integration is observed (i.e., reduced bimodal relative to unimodal variance) and whether the predicted weights from the unisensory estimates are consistent with those observed during the bimodal estimates. This could provide further insights into whether individuals with concussion benefit from multisensory inputs and/or weight multiple inputs optimally.
It is also possible that people with concussion show changes in multisensory processing, or in their ability to effectively combine and integrate sensory input. Specifically, during sensory integration, the brain typically weights sensory information based on each input’s relative reliability. It is possible that following brain injury, there are changes in the brain’s ability to combine or integrate and optimally weight incoming sensory information, which might lead to postural instability, increased visual dependence and other adverse effects related to concussion (e.g., dizziness, migraines and motion sickness). Recent research has shown that multisensory, visual-vestibular training could be used to improve self-motion perception,68 potentially by means of sensory recalibration.69 It is also known that vestibular training can be used to improve standing balance by promoting sensory reweighting (e.g., improving multisensory integration).69,70 Mechanistically, multisensory learning could result in greater neural activation which may be necessary for perceptual training to occur.71 Ultimately, if individuals with concussion could be trained to weight incoming sensory cues more optimally during mobility-related tasks, they may be able to generate more effective behavioral responses to visual perturbations. Such training may also allow for a reduction in visual dependence which could resolve certain undesirable symptoms associated with concussion that are thought to be exacerbated by visual dependence (e.g., dizziness).12 Therefore, future studies could consider not only testing whether individuals with concussion do indeed demonstrate imprecise reliability-based weighting of sensory cues during self-motion (e.g., suboptimal reliance on visual information), but also test whether it can be improved with multisensory or cross-modal training.1,72–76
While the sample size of the current study allowed us to observe many significant and robust group-related differences, it was too small to allow us to analyze additional interesting individual factors. For instance, of the 15 participants with concussion, six were symptomatic and nine were asymptomatic at the time of the study. This sample size was not large enough to allow for statistical comparisons between subgroups or examine the data for sex-related differences. However, we visually differentiated the two concussion sub-groups in Figure 4 and descriptively (although not statistically analyzed) the symptomatic participants appear to report higher levels of vection and demonstrate larger postural sway than asymptomatic participants (see Supplemental Figure 2). Future studies could consider how symptom status (symptomatic vs. asymptomatic), as well as, for example, symptom classification types (e.g., vestibulo-occular vs. cervicogenic, vs. physiological subtypes of post-concussion disorder; 77–79) and sex affect experiences of vection, postural stability and visual dependence. With regards to measuring vection, participants were only asked to rate their vection intensity after each trial. In the vection literature, however, it is also common to measure vection onset times and vection duration.54 Understanding the temporal dynamics of vection experiences (e.g., immediate vs. delayed onset vection) could provide additional insights into the mechanisms underlying the association between concussion, vection, visual dependence and postural responses. Likewise, future studies could consider using neurophysiological measures like EEG or fMRI (i.e., electroencephalogram and functional magnetic resonance imaging) to examine whether cortical responses differ between individuals with concussion and healthy controls.80 Furthermore, we only presented each vection trial for 30 s, whereas longer trial durations (e.g., 60 or 120 s) may have resulted in greater vection saturation. This may explain why the average vection ratings in this study were relatively low (4.74/10 for concussed individuals, 3.24/10 for controls). It is also possible that introducing a rotational vection stimuli may provide additional insights into concussion-related differences56,81 and may be differentially associated with other measures such as visual dependence and postural responses.
Conclusion
In this study, participants visually travelled through a realistic, common, cluttered visual scene (grocery store) to investigate whether individuals with concussion would experience stronger feelings of vection relative to healthy controls and whether stronger vection would be associated with greater visual dependence and/or larger changes in postural stability in response to visual perturbations. The results of this study demonstrated that, relative to controls, concussed individuals tended to report stronger vection overall. For concussed individuals only, as vection intensity ratings increased and as the speed of the visual stimulus increased, so did the amount of postural sway. Finally, visual dependence was positively associated with vection ratings and all postural measures in concussed participants but not controls. Our results may help to better characterize the perceptual changes accompanying concussion with respect to self-motion perception and may be useful in the context of symptom-screening tools and rehabilitation-focused interventions.
Summary points
-
Common, everyday scenarios that include crowded visual scenes or visual motion, tend to trigger unwanted symptoms in individuals with concussion. Grocery shopping is one such, well-reported, often cited, scenario.
-
One possibility is that people with concussion may be more susceptible to visual motion than healthy controls.
-
Vection is a phenomenon commonly experienced by healthy individuals whereby dynamic visual information creates the illusion of self-motion in physically stationary observers; however, whether concussion increases susceptibility to vection is unknown.
-
We measured visual dependence in people with concussion and healthy controls, via a rod and disk task.
-
Using a 240° horizontal field-of-view curved projection display, we also measured perceived vection intensity, by presenting participants with an immersive, outwardly radiating virtual grocery store scene (15 different visual motion speeds across 15 separate trials). Changes in postural stability were measured as participants stood on a forceplate during this task.
-
Individuals with concussion reported stronger feelings of vection than healthy controls,
-
Stronger feelings of vection predicted more postural sway (instability), particularly at faster visual speeds, but only in participants with concussion (not healthy controls).
-
Individuals with concussion also showed higher degrees of visual dependence than healthy controls.
-
Ultimately, better understanding the perceptual aspects of self-motion perception post-concussion could have implications in the development of symptom-screening tools and rehabilitation interventions.
Supplementary data
To view the supplementary data that accompany this paper please visit the journal website at: www.futuremedicine.com/doi/suppl/10.2217/cns-2460476
Financial disclosure
This research was funded by a Canadian Institutes for Health Research Grant awarded to LE Sergio and JL Campos, and a VISTA Post-Doctoral Award granted to MS Adams. JL Campos also holds a Canada Research Chair II in Multisensory Integration and Aging (950-232488) from the Government of Canada.
Competing interests disclosure
The authors have no conflicts of interest to declare.
Ethical conduct of research
Written informed consent was provided prior to the study and participants were paid $50 (in the form of a gift card) for their participation. This research was conducted in compliance with the American Psychological Association Code of Ethics and was approved by the University Health Network Research Ethics Board (19-5060).